CALCULATE CEP
Allows user to calculate the Circular Error of Probability for the current records in the Data Table. This functionality can help determine the accuracy of your GPS Unit at a given location and a given time. Because of a variety of factors (multi-path, satellite configuration changes, atmospheric conditions, etc.), points collected in the same location will not be recorded at the exact same coordinates, they will wander a bit. The CEP option uses a reference point, either supplied by the user or by calculating the average of all the points, to generate a series of circles that represent the 50%, 90%, 95% and 98% circular error of probability.
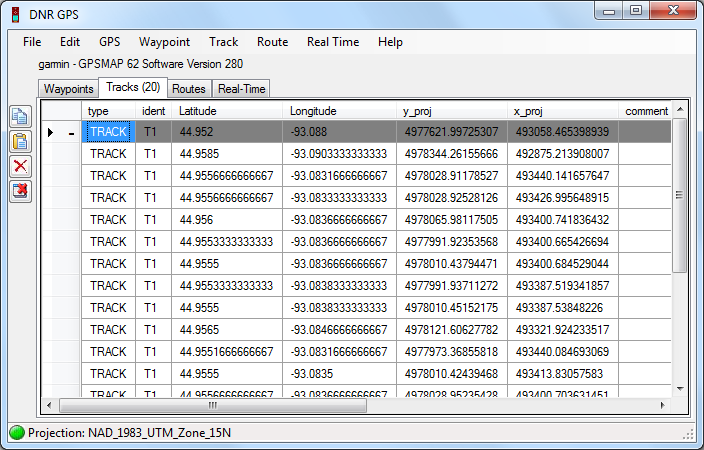
Load the points into the data table. All points in the table should reference the same location. (To create these points, collect track points every 5 seconds for 30 minutes with your GPS sitting in one location. Then download the track file to DNRGPS.)

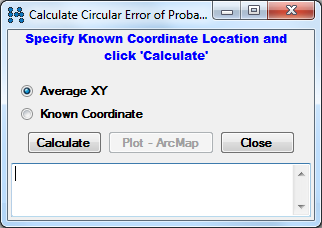
Go to Edit => Calculate CEP. A Calculate CEP window will appear.

If you know the exact coordinates of the location where the data was collected, select the “Known Coordinate” option and enter in the coordinates. If these coordinates are not known, select the “Average XY” option. The average point location will be used in lieu of a known point.
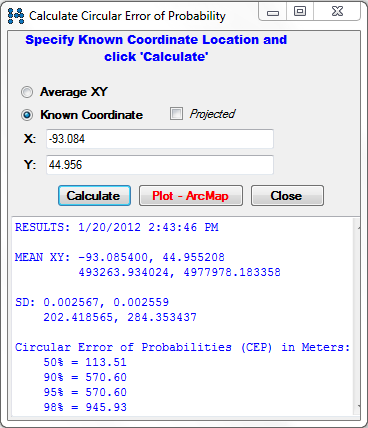
Click on the “Calculate” button. A report is generated that gives various statistics of the scattered points, including the Circular Error Probability measurements.

The example above states that 50% of the track points are located within 113.51 meters of the actual location (would calculate from average location if that was entered in step 2). 95% of the points are within 570.60 meters of the known location and 98% are within 945.93 meters. Note that this example was derived from a small number of points, so your ranges are likely to be far smaller.
(Not yet functioning) If ArcMap is open you can click on the “Plot” button to plot out the results on a map to give a visual explanation of the report. Save your track points to a point file and view them too.
Note: The Data Frame must be projected in order to plot to the map. The Data Frame’s projection will be used to place the graphics on the screen.